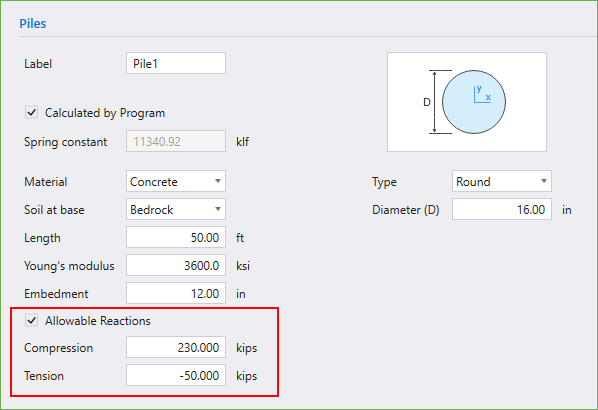
Figure 2 – Piles Properties (spMats)
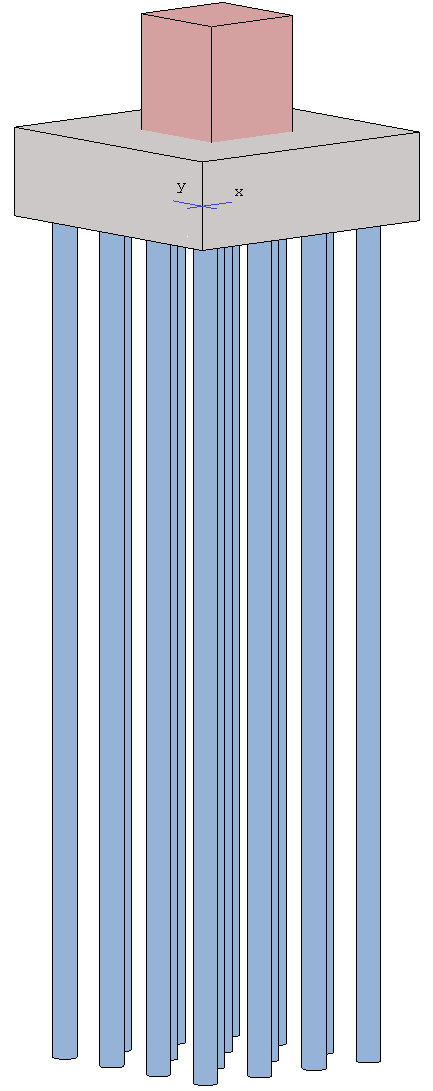
Figure 3 – 3D View Pile Cap Foundation (spMats)
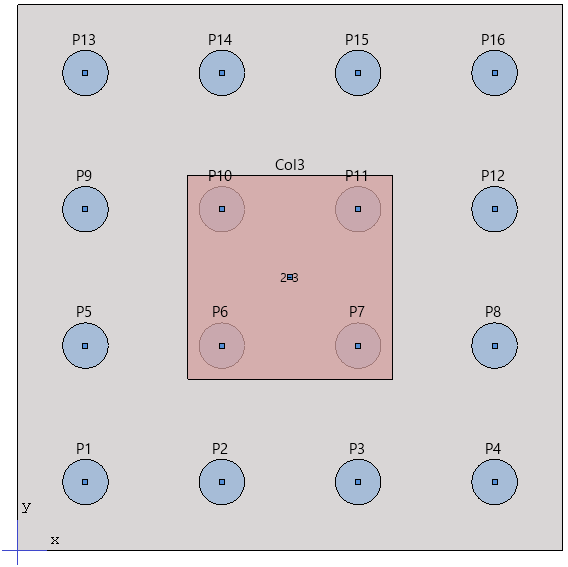
Figure 4 – Plan View Pile Cap Foundation (spMats)
In spMats, pile reactions are represented graphically with directional arrows - upward arrows for compression and downward arrows for tension following the program sign convention for coordinate axes. When allowable pile reactions are defined by the user as shown in Figure 2, the program will automatically evaluate each pile's reaction against the defined limits. Pile reactions that do not exceed the allowable values are displayed in blue, while those that exceed are highlighted in red to alert the user. A warning icon will also appear in the Contours tree to indicate that one or more pile reactions exceed the allowable limit. Note that allowable pile reactions, when specified, are only applicable to and compared with the Service pile reactions.
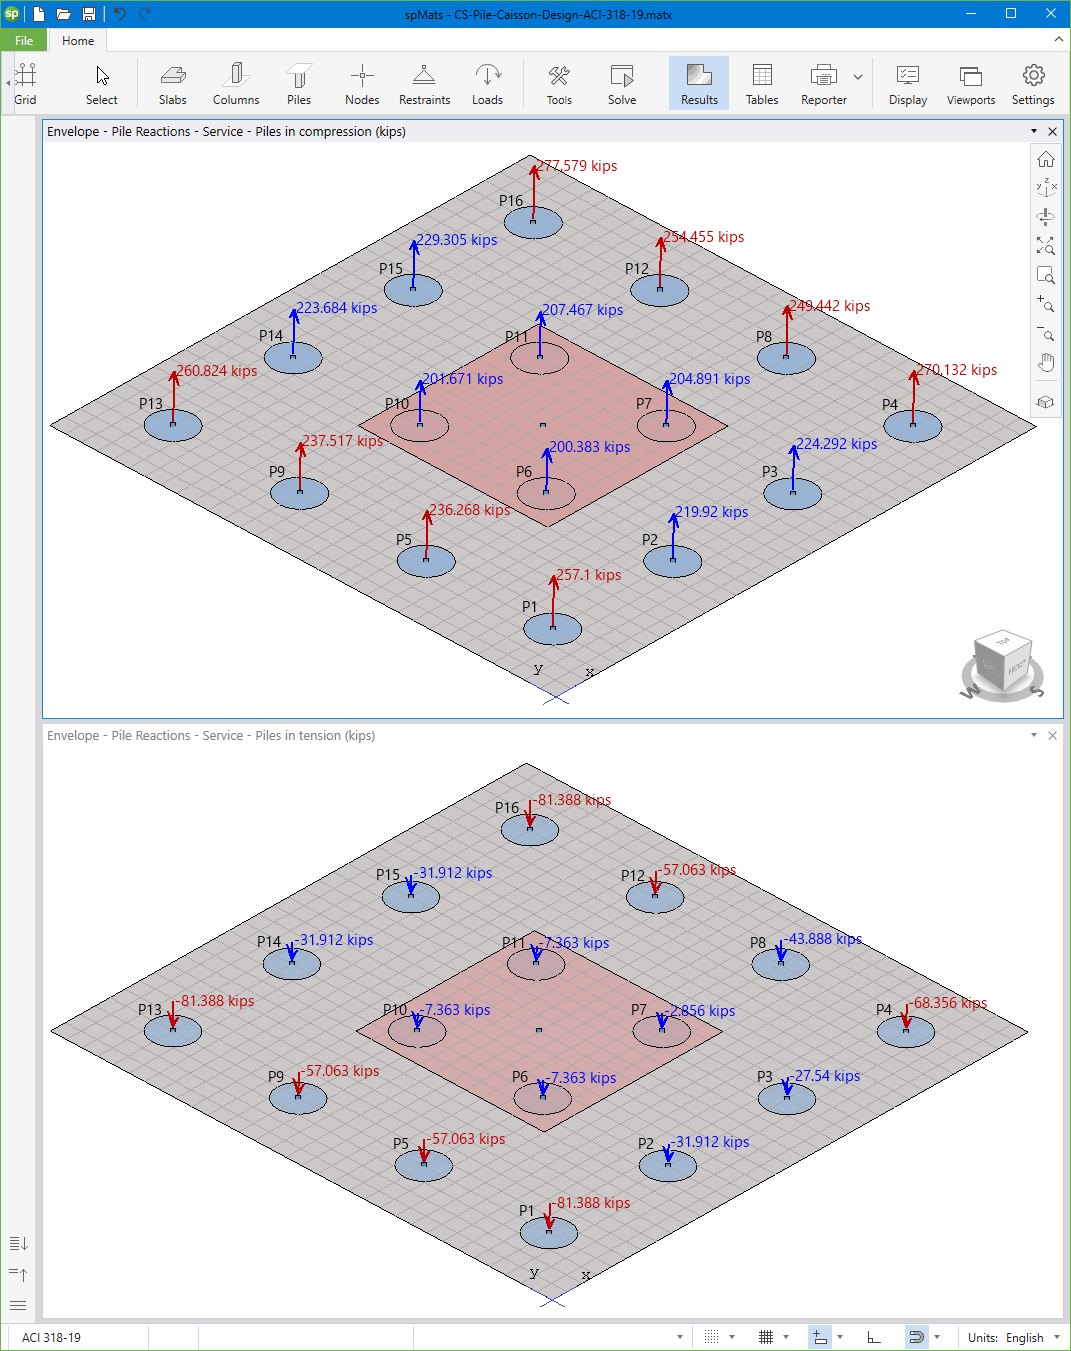
Figure 5 – Pile Service Reactions* (spMats)
* Pile reactions that do not exceed the allowable values are displayed in blue, while those that exceed are highlighted in red to alert the user.
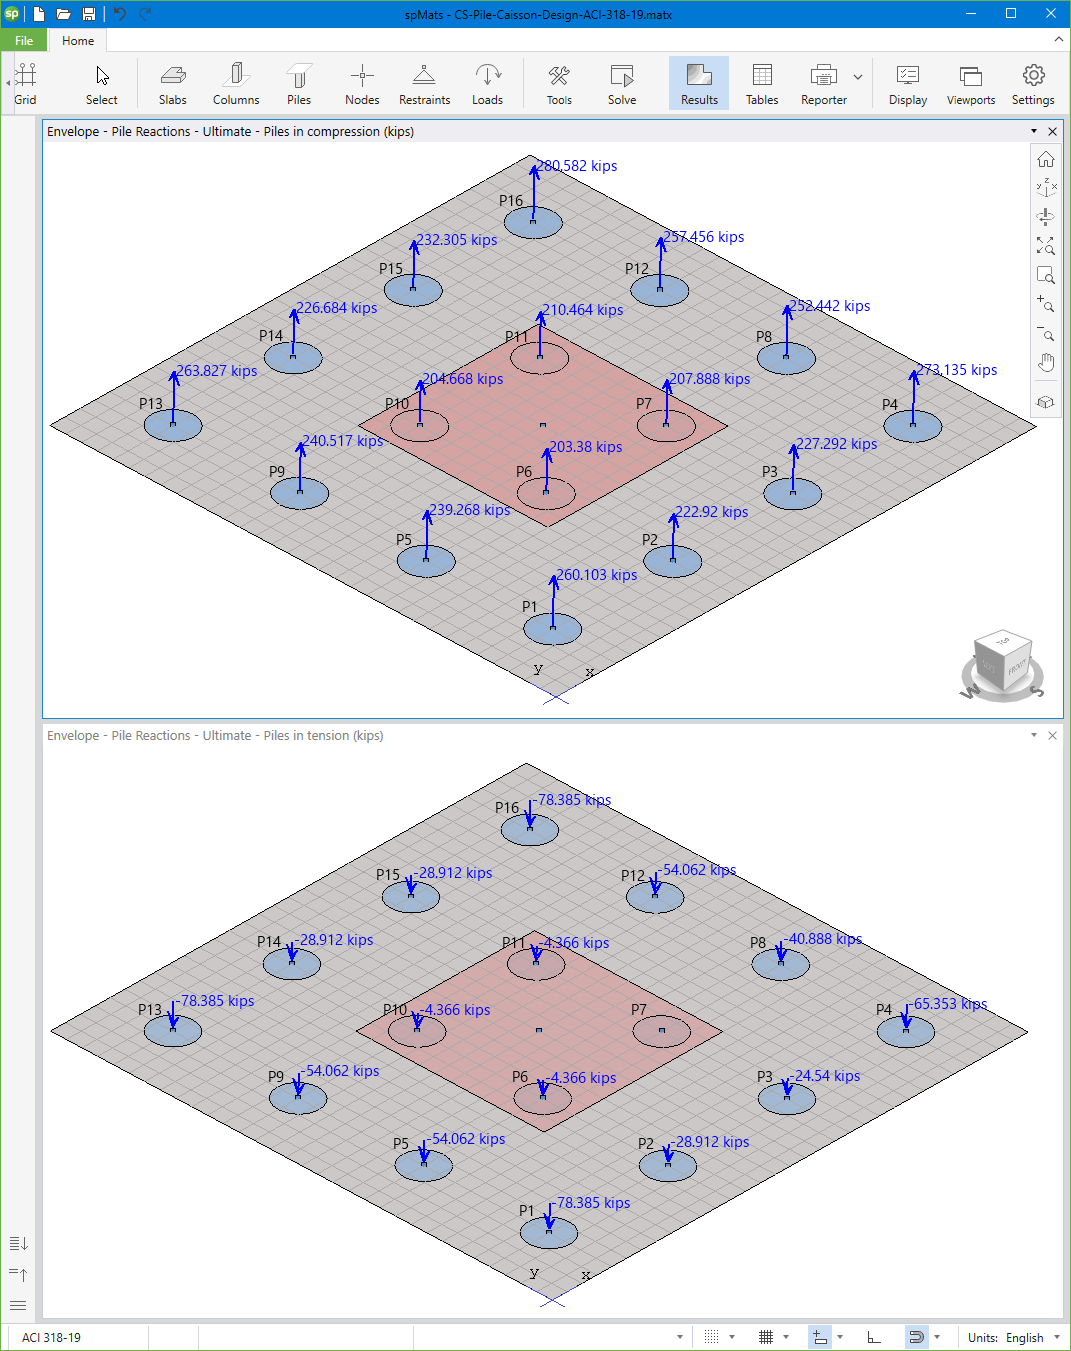
Figure 6 – Pile Ultimate Reactions (spMats)
In the tabular output, the program provides a summary of the individual pile reactions from service and ultimate load combinations. Each pile is identified by its Pile ID, Pile Label, and the Node to which it is assigned, along with the corresponding Node ID. The service reaction for each pile is compared against the user-defined allowable limits. If a pile's service reaction exceeds its allowable limit, an "x" mark is flagged in the corresponding row, indicating that the allowable reaction has been exceeded.
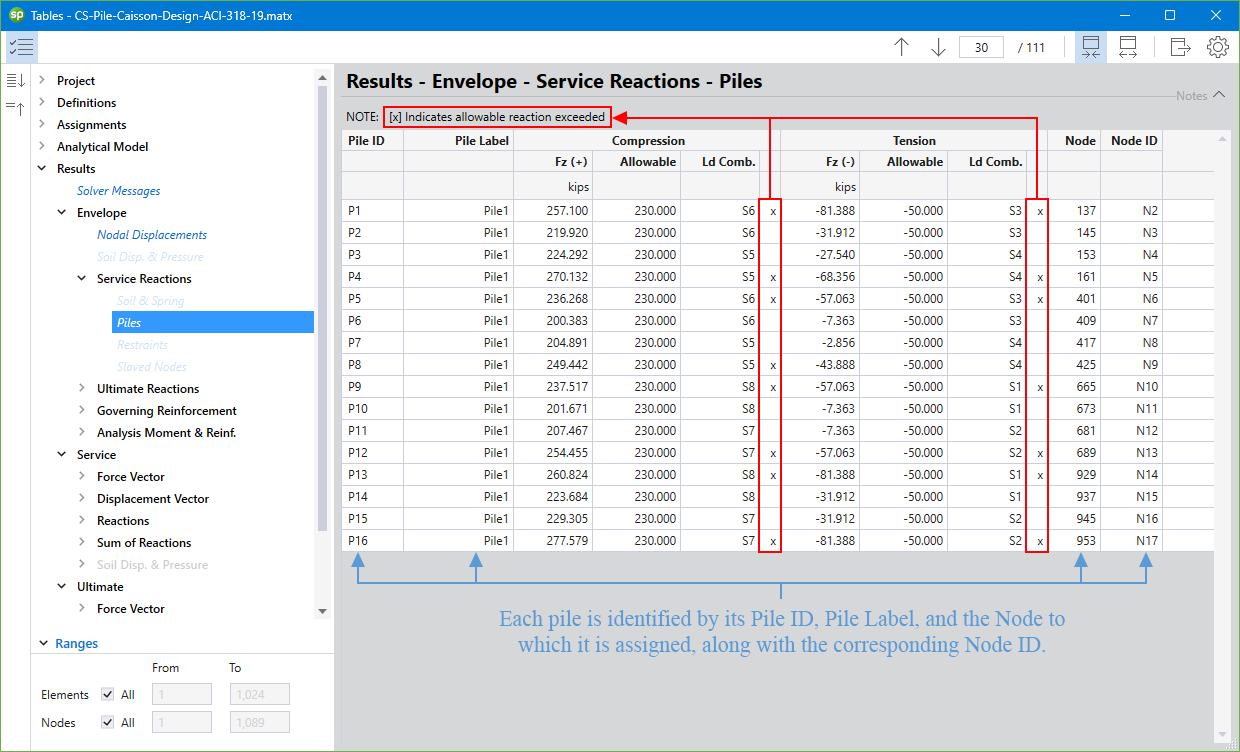
Figure 7 – Pile Service Reactions Table Output (spMats)
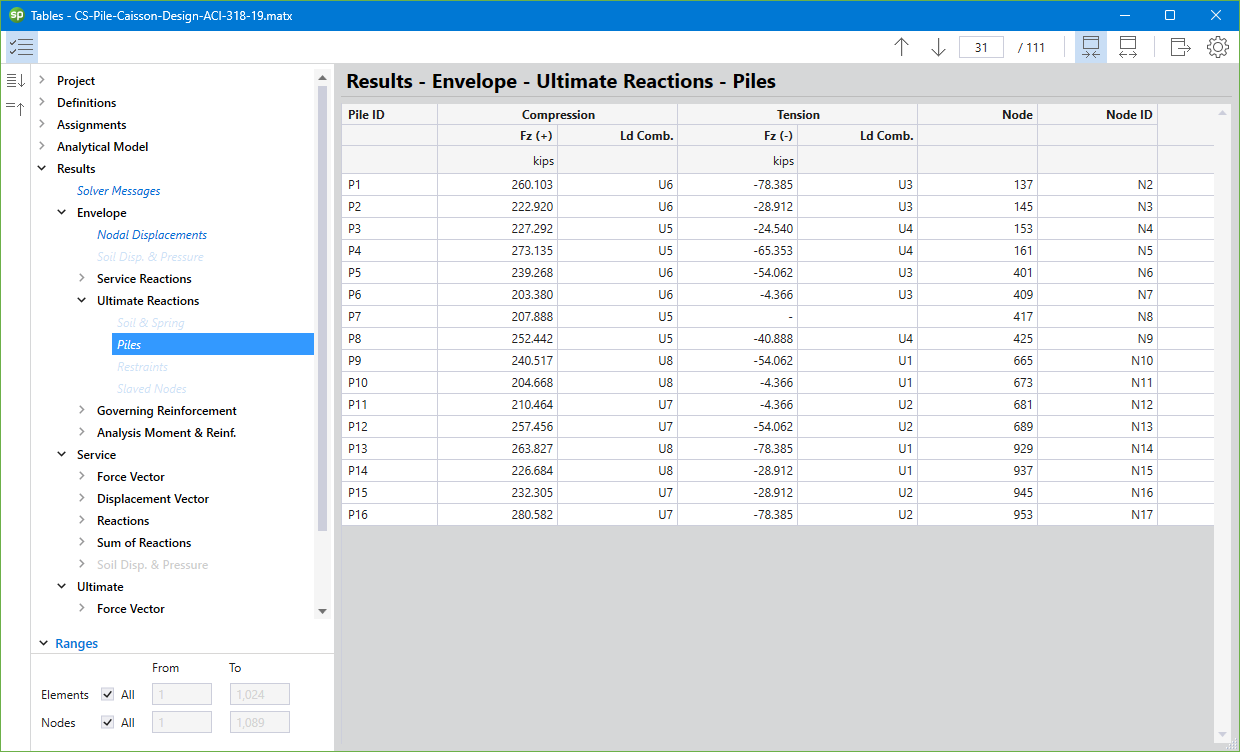
Figure 8 – Pile Ultimate Reactions Table Output (spMats)